The Margin QB Grade: one number for every quarterback play
Our quarterback rating fits in one sentence: the points a quarterback adds per play, on a scale where 50 is average. We scored it against eleven other QB ratings, including ESPN's QBR and Silver Bulletin's QBERT, on tests we wrote down first. It's the best at describing a game. On predicting what comes next, nobody separates. And the extra data we tried to add didn't earn a place.
We wanted one quarterback number that works for a single game, a season, a career and "how good is he right now," that we could compute while the game is on, and that we could explain in one sentence. Here's the sentence:
The Margin QB Grade is the points a quarterback adds per play. Every dropback counts: completions, incompletions, sacks, scrambles. So do his designed runs and the pass penalties he draws or commits. An interception costs a flat 4 points, no play counts for more than 4 points either way, and the scale is set so that 50 is an average quarterback play from 2006 to 2021.
That's the whole formula. The rest of this post is why we built it that way, how it compares with other quarterback ratings, and the part that didn't work.
What the number means
"Points" is expected points added (EPA): how much a play changed the points the offense could expect from that drive. A 9-yard completion on 3rd-and-8 adds a lot; the same 9 yards on 3rd-and-12 adds less; a sack loses points. The grade averages that over every play the quarterback touches.
Two choices need explaining. An interception is charged a flat −4 instead of its own EPA, because its cost is mostly the throw, not where on the field it happened. The average interception costs a little more than 4 points, so −4 is the average, capped like every other play. The cap is there because one 80-yard catch-and-run or one pick-six can swing a game's average a lot, and little of that swing is about the quarterback.
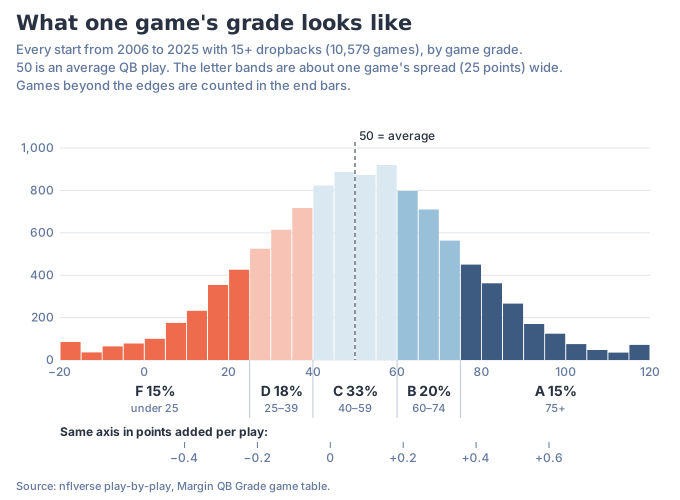
One game's grades spread about 25 points either side of average, so the letter bands are about that wide:
 Tap to open full size, or swipe to pan.
Across 10,579 starts from 2006 to 2025 (15 or more dropbacks), 15% graded an A (75 and up), 20% a B, 33% a C, 18% a D and 15% an F (under 25). Each 0.1 points per play is worth about 8.6 grade points, so a 75 is a quarterback adding about 0.36 points per play.
A single game is noisy. Drake Maye graded 115.1 against Carolina in Week 4 last season, on 22 plays. That's a real game with a real grade, but nobody should read 22 plays as his level. So the longer grades deal with sample size directly:
- Season and career grades are pulled toward 50 as if he'd also run 100 average plays. Thirty plays sit near 50 however they went; 600 plays are barely pulled at all. Each season grade has an 80% range for how much an average of that many plays moves by chance: about ±10 points at 100 plays, ±7 at 300, ±5.4 at 600.
- Right now is how good he is today. It uses his whole career, but each past season counts 45% as much as the one after it. A newcomer starts from where his draft slot says rookies usually play: 49.8 for a No. 1 pick, 44.4 for the 32nd, 40.9 undrafted. Each game is also adjusted for half of how good the pass defense he faced had been before that game.
How it compares with other QB ratings
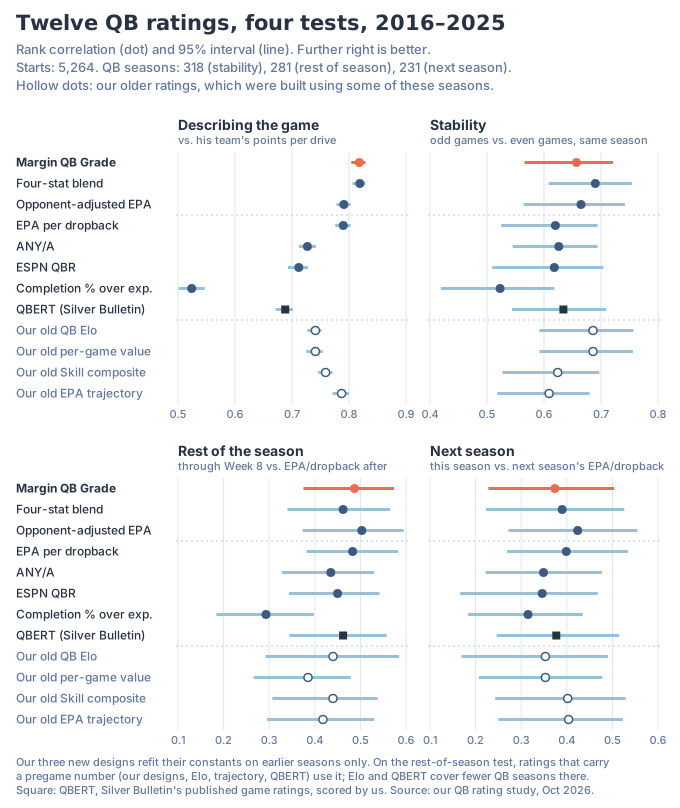
We didn't start with this formula. We built three designs separately and scored them on a scorecard written before any of them existed, alongside every other quarterback rating we could score the same way: the plain stats (EPA per dropback, ANY/A, completion percentage over expected), ESPN's QBR, Silver Bulletin's QBERT, and four ratings we had built earlier (a QB Elo, a per-game value rating, a Skill composite and a running EPA trajectory). Every rating is scored on the same starts: the team's main quarterback, 15 or more dropbacks, regular season. (QBERT's ids matched 5,243 of our 5,264 starts. Our old QB Elo and per-game value rating share one game number, so they match on every test except rest of season.) The tests:
- Describing the game: does his game number line up with how many points per drive his offense scored that day?
- Stability: does his number in odd-numbered games match his even-numbered games in the same season?
- Rest of the season: does his number through Week 4, 8 or 12 predict his EPA per dropback the rest of the way?
- Next season: does this season's number predict next season's EPA per dropback?
The other two designs were a four-stat blend (EPA, success rate, completion percentage over expected and touchdown rate, with fitted weights) and an opponent-adjusted EPA rating carried game to game. For each season from 2016 to 2025, all three refit their numbers on earlier seasons only, then rated that season.
 Tap to open full size, or swipe to pan.
Describing a game is where the grade stands out. Across 5,264 starts, its rank correlation with the offense's points per drive was 0.818. The blend was 0.819, EPA per dropback 0.790, ANY/A 0.727, QBR 0.712 and QBERT 0.688. Because every rating is scored on the same games, the gaps can be measured directly: the grade beats EPA per dropback by 0.028 (95% interval 0.022 to 0.033) and QBERT by 0.129 (0.119 to 0.141). Against the blend it's −0.001 (−0.008 to +0.006), a dead tie. Much of the gain over EPA per dropback comes from counting more of a quarterback's plays: designed runs and pass penalties are his, and a dropback stat leaves them out. QBR and QBERT are built differently, with adjustments a raw scoreboard doesn't make (QBR, for one, discounts garbage time), so they were never going to track points per drive as closely. QBERT's unadjusted game number does a bit better than its adjusted one, 0.714 to 0.688; we chart the adjusted one because it's the game figure in Silver Bulletin's own game breakdowns.
On the other three tests, nobody separates. Stability: the blend (0.690) and our old QB Elo (0.686) were a little ahead of the grade (0.657), all with overlapping intervals. Rest of the season through Week 8: the opponent-adjusted design was highest at 0.503, the grade 0.487, EPA per dropback 0.483, QBERT 0.462. Next season: the opponent-adjusted design was highest at 0.424, then our old trajectory (0.404) and Skill composite (0.402), EPA per dropback (0.399), QBERT (0.377) and the grade (0.374). The opponent-adjusted design beat the grade on next season by 0.050 (+0.010 to +0.085), the one gap there that we measured clear of the noise, but it didn't clearly beat plain EPA per dropback (+0.025, −0.009 to +0.061). Against QBERT the grade is level on next season (−0.009, −0.066 to +0.052) and on predicting the next game from the pregame number (−0.002, −0.015 to +0.011).
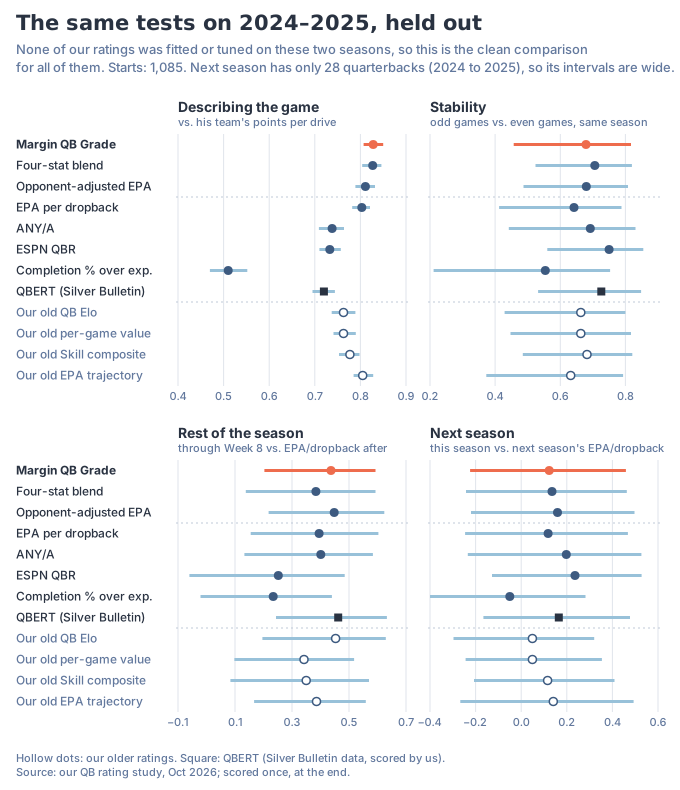
Two cautions about that chart. Our four older ratings were built using some of the 2016 to 2023 seasons, so they get a home-field edge there. We don't know when QBERT's history was computed either. That's why 2024 and 2025 were locked away for every rating we built and scored once at the end:
 Tap to open full size, or swipe to pan.
The describing-the-game order held: 0.828 for the grade, 0.827 for the blend, 0.811 for the opponent-adjusted design, 0.805 for our old trajectory, 0.803 for EPA per dropback, 0.733 for QBR and 0.720 for QBERT. On stability, QBR (0.750) and QBERT (0.726) were ahead of the grade (0.679). Through Week 8, QBERT (0.462) and our old Elo (0.453) were ahead of the grade (0.437). The next-season panel rests on only 28 quarterbacks who had 200 dropbacks in both 2024 and 2025, so every rating's interval there is about 0.6 to 0.7 wide and it can't rank anything.
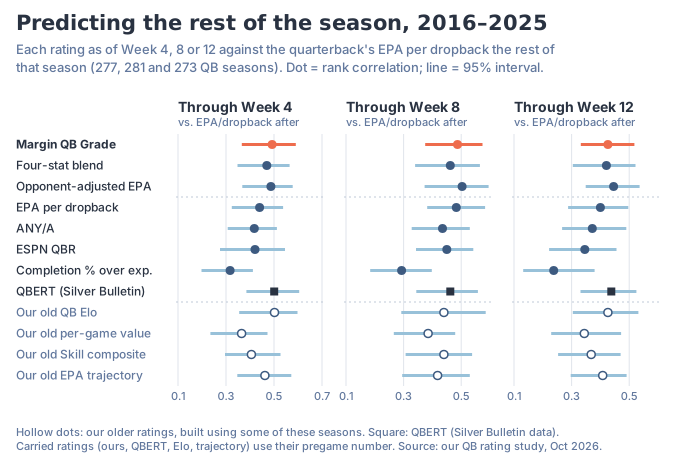
The in-season test at each checkpoint shows the same picture:
 Tap to open full size, or swipe to pan.
At Week 4, QBERT (0.501) and our old Elo (0.502) were a hair ahead of the grade (0.492); at Week 12, QBERT (0.438) and the opponent-adjusted design (0.446) were. These ratings are scored from their pregame numbers, and QBERT and Elo are missing some quarterback seasons there, so their rows aren't the same quarterbacks as ours. The honest read is a tie among the carried ratings, all a little ahead of plain season-to-date stats early in the year.
So the grade is a description of how a quarterback played, tied for the best one we tested at that. The forward-looking pieces live in the "right now" grade. Carrying a rating game to game, the way Nate Silver's QBERT does, is the idea behind it, and fading old seasons and starting rookies from their draft slot are where those pieces helped on our scorecard. With the blend and the grade tied on description, we took the simple one. The grade is one ingredient and one sentence; the blend needs four stats and three fitted weights and bought nothing for them.
A few other ideas didn't make it. Giving receivers part of the yards after the catch made every test worse. Adjusting each game grade for the defense helped one test and hurt another. Discounting garbage time matched wins a bit better and predicted next season worse.
Where the grade and QBR disagree
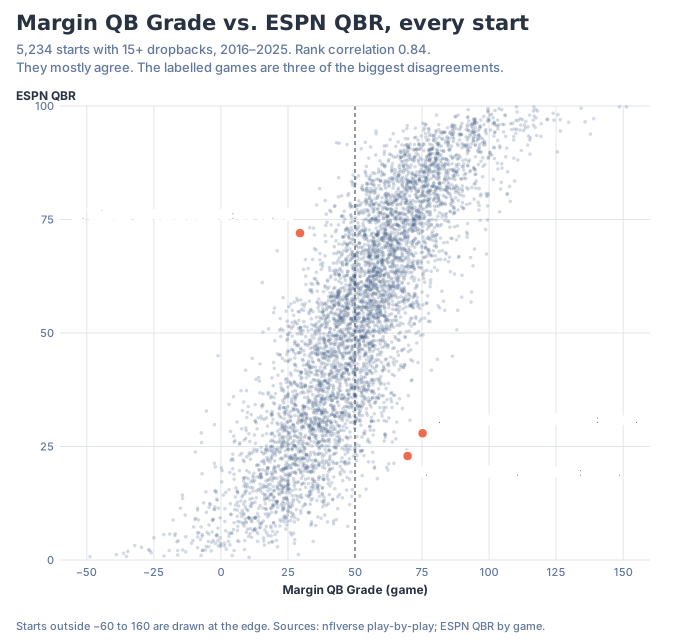
QBR is the rating most people know, so here is every start next to it:
 Tap to open full size, or swipe to pan.
They agree most of the time: a rank correlation of 0.84 across 5,234 starts. The big disagreements come from a few specific choices.
- Garbage time. Josh Johnson's Jets lost 45–30 at Indianapolis in 2021. He graded 75; QBR had him at 28. Forty-one of his 48 plays came with the game all but decided (win probability under 10% or over 90%), and those plays produced 14.5 of his 17.2 points. QBR discounts that time of the game. The grade counts it, because we tested a discount and it made next-season prediction worse. Carson Wentz's 2025 win over Cincinnati, 48–10, is the same story from the other side: 14 of his 25 plays came with the game already decided, and they account for all of his positive total.
- Interceptions. Russell Wilson threw three in Seattle's 30–24 loss at Jacksonville in 2017. By EPA, where they happened made them cost 6.7 points combined. The grade charges a flat 4 each, 12 in all, and had him at 30. QBR had him at 72.
The data that didn't help
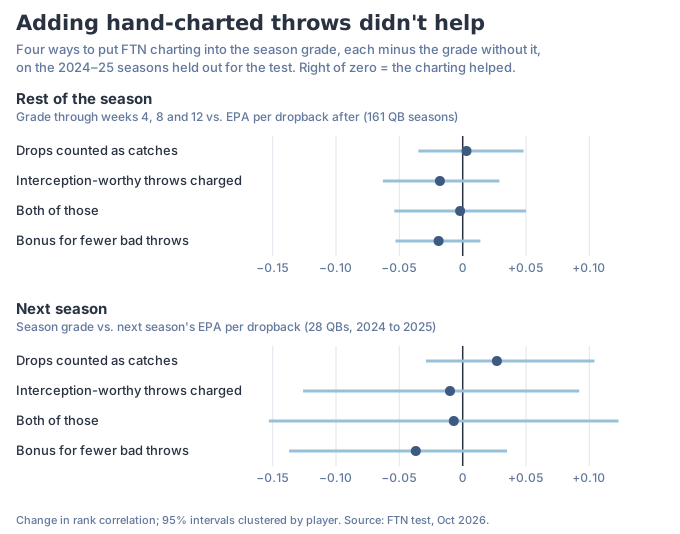
FTN charts every throw by hand: was it catchable, should it have been intercepted, did the receiver drop it. It's the obvious thing to add. A quarterback whose receiver drops a perfect throw is charged with an incompletion, and one whose interception-worthy throw is dropped by a linebacker gets away with it.
Before running anything, we wrote down four ways to put charting into the season grade and the rule for adopting one: it had to improve both the rest-of-season test and the next-season test on 2024 and 2025, with intervals clear of zero. None did.
 Tap to open full size, or swipe to pan.
The rest-of-season test had 161 quarterback seasons, enough to see a real effect, and the best version improved it by 0.003. The next-season test had only 28 quarterbacks, and we said in advance it could only catch a large gain (about 0.10). So for next season the honest answer is "not shown," not "proven useless": a gain around 0.03 can't be ruled out, and the test can be rerun as seasons come in. For now, charting stays out of the grade.
It's still worth looking at. Interception-worthy throws are a steadier habit than interceptions: from 2022 to 2025, a quarterback's interception-worthy rate in odd-numbered games matched his even-numbered games at 0.45, while his actual interception rate matched at −0.07, no relationship at all. So QB pages show bad throws, interception-worthy throws and drops in a Ball placement section beside the grade. Charting also arrives days after the game, so it couldn't be in a live grade anyway.
2025, the whole field
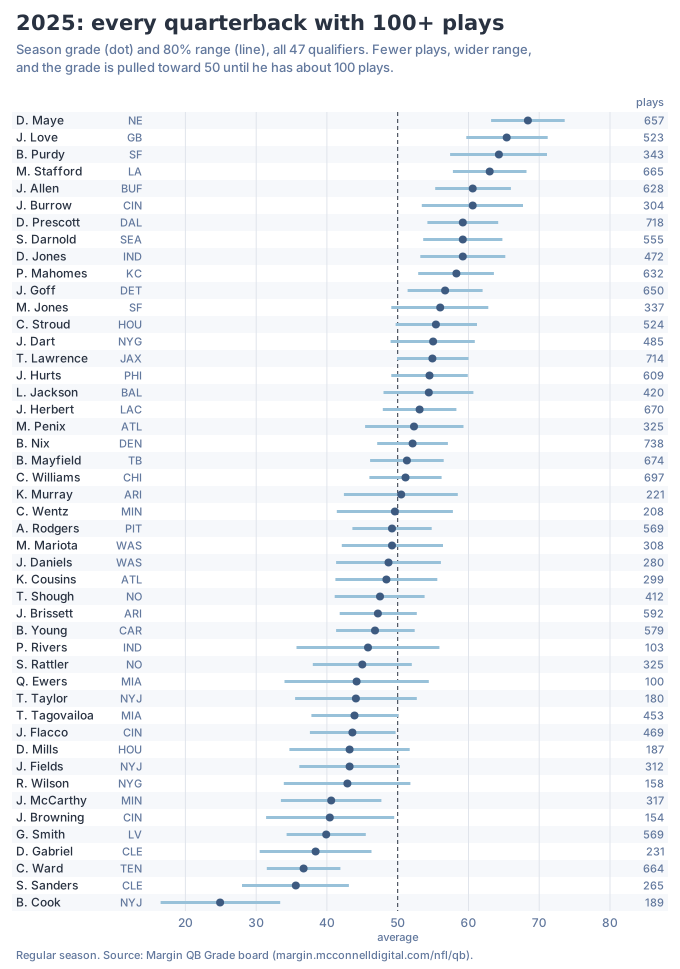
Every quarterback with at least 100 plays last season, all 47:
 Tap to open full size, or swipe to pan.
Maye led at 68.4 over 657 plays (range 63.2 to 73.6), up from 46.6 as a rookie. Jordan Love (65.4) and Brock Purdy (64.3) were next; Purdy's range is wider because he had 343 plays. Matthew Stafford's 63.0 was the best of his 17 seasons. Cam Ward, the first pick in the draft, graded 36.7 over 664 plays.
Read the ranges before the order. All of the top 10 have ranges that reach Maye's low end, so the order among them isn't settled. Only 11 of the 47 have a range entirely above 50 and 8 entirely below it. The other 28 can't be told apart from average on one season.
Through Week 4 of 2026, the right-now leaders are Purdy (64.2), Josh Allen (61.9), Jared Goff (59.9), Dak Prescott (59.2) and Lamar Jackson (58.6). Right now and this season can disagree on purpose: Maye's 2026 season grade is 50.2 after 156 plays, but his right-now grade is 58.1, because four games don't erase 2025.
One career
 Tap to open full size, or swipe to pan.
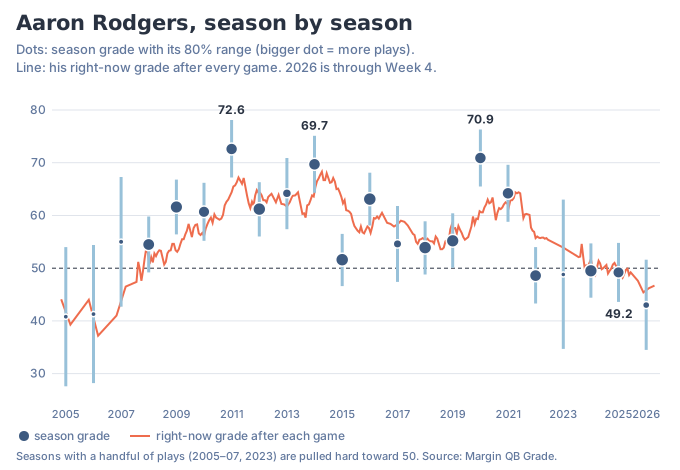
Aaron Rodgers shows how the pieces fit. His best seasons graded 72.6 (2011), 69.7 (2014) and 70.9 (2020). His first three seasons (20, 21 and 37 plays) and his 3-play 2023 sit near 50 with wide ranges, because the grade won't say much about that few plays. Since 2022 he's been an average quarterback: 48.6, 49.5, 49.2. Through four games of 2026 he's at 43.0 (34.5 to 51.6), and his right-now grade has slipped to 46.7.
What it can't tell you
The grade gives the quarterback the whole play. The line, the receivers, yards after the catch and the play call are all in it, and nothing here separates them. A quarterback in a great offense is graded up.
The scale is fixed on 2006 to 2021, so it moves with the league. The average play graded 45.5 in 2006, 55.0 in 2020 and 51.0 in 2025. A 60 in 2006 was a better season, relative to that league, than a 60 now.
And it doesn't forecast better than the alternatives. If you want to guess next season, plain EPA per dropback did about as well as anything we tested.
Where to find it
- The QB board has every quarterback's season grade and range, last game, right now and career, plus a by-week view of every game grade. Click a quarterback for every season, every game and his Ball placement section.
- The live QB board grades each quarterback during the game with a letter from A to F, alongside his season and right-now grades if the game ended now. The final grade comes the next morning.
- QB trajectories plots the running grade after every game since 1999.
- The MVP watch uses each quarterback's season-to-date grade as its quarterback input.
More from The Margin
All analysis- Team EPA per play is free on The Margin now. Here's what it says about who wins Super Bowls.
Jesse McConnell, Oct 6, 2026. NFL, 5 min read
Offense and defense EPA per play for all 32 teams, free, on the team ratings page and every team file. Since 2015, 8 of 11 champions were above average on both sides of the ball, and none was below average on both.
- How our NFL model works
Jesse McConnell, Oct 6, 2026. NFL, 3 min read
What goes into our NFL game projections, how a team rating becomes a projected margin and win probability, and why the market's line sits beside our number instead of inside it.
- How our college football model works
Jesse McConnell, Oct 6, 2026. CFB, 2 min read
What goes into our college football game projections, how a preseason rating and this season's results become one team rating, and why the market's line sits beside our number instead of inside it.