Can you predict an NFL quarterback from college? The draft looks smarter than it is.
We scored 242 quarterback prospects from 2009 to 2021 on everything we could find before the draft: combine drills, college stats, team success, recruiting stars, Heisman votes. Nothing beat the order teams drafted them in. But most of the draft's edge is that it decides who gets to play. Once they're on the field, the public scouting consensus predicts almost nothing, and two things do: what teams know privately, and whether the quarterback could run.
Every April the case for a quarterback comes down to what he did in college and what he ran at the combine. And every year somebody from the third round becomes a starter and somebody from the top five doesn't.
So we asked the obvious question: can you predict which college quarterbacks will be good in the NFL from the numbers? We took every quarterback drafted from 2009 through 2021, plus every undrafted quarterback invited to the combine, 242 in all, and threw everything at it. Combine drills, hand size, college efficiency, starts, team success, supporting cast, recruiting stars, years in school, Heisman votes.
The first answer looks simple: nothing beats where a quarterback was drafted. The more interesting answer is why.
The draft looks unbeatable
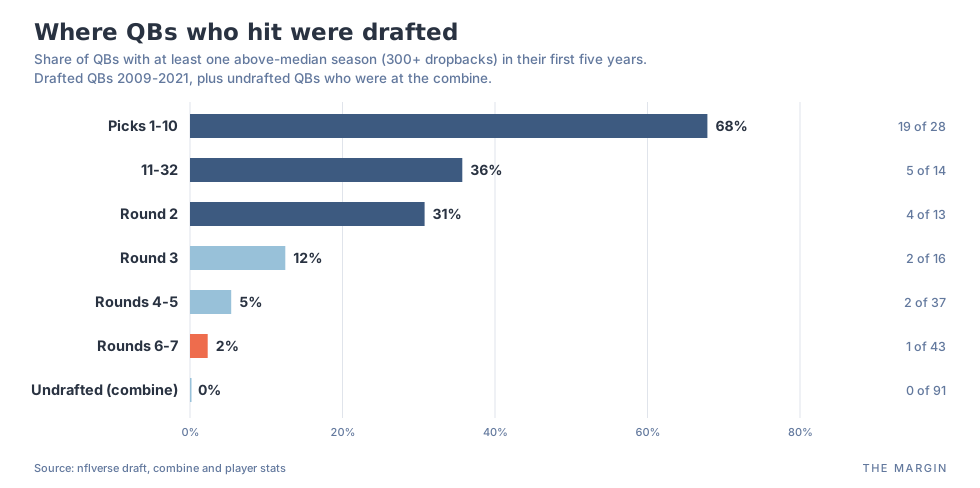
We started with a simple bar. A quarterback hit if he had at least one season in his first five with 300+ dropbacks and EPA per play above that year's median starter. That's one good season, a low bar on purpose. Mitchell Trubisky clears it. 33 of the 242 did.
 Tap to open full size, or swipe to pan.
Top-10 picks hit 68% of the time. In rounds 6 and 7 it's 1 of 43. Undrafted combine quarterbacks: 0 of 91.
 Tap to open full size, or swipe to pan.
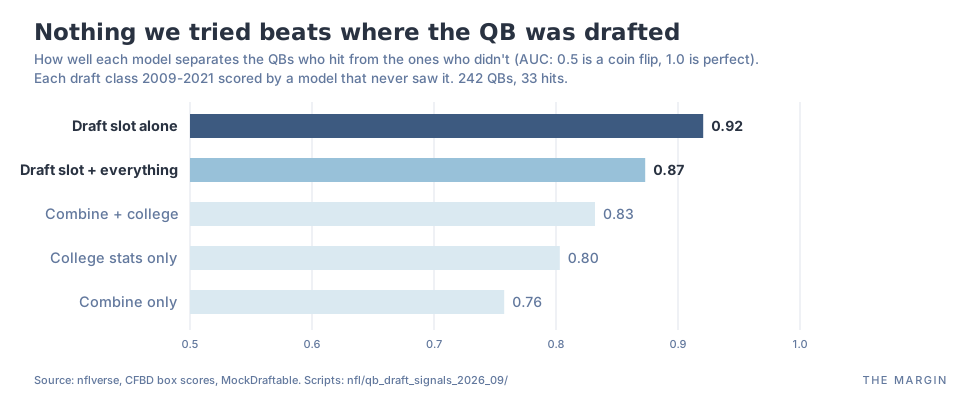
Draft slot alone separates hits from misses at 0.92 (AUC, where 0.5 is a coin flip). Combine and college stats together get 0.83. Stack everything on top of draft slot and the model gets slightly worse. Every model here was scored on draft classes it never saw.
Taken at face value, that says NFL teams know something about quarterbacks that no stat sheet captures. Part of that is true. But most of it isn't knowledge.
Draft slot decides who plays
To hit, a quarterback has to play. And teams play the quarterbacks they spent high picks on.
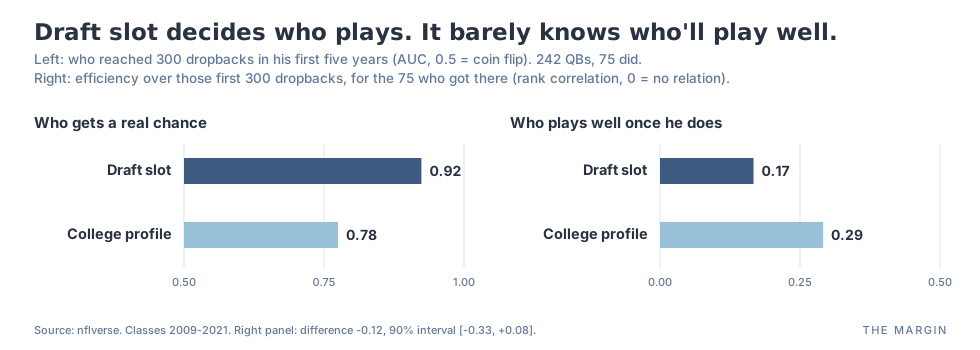
So we split the question in two. First: who got a real chance, meaning 300 dropbacks in his first five years? 75 of the 242 did. Second, among those 75: who played well over those first 300 dropbacks?
 Tap to open full size, or swipe to pan.
Draft slot is very good at the first question, and it should be, because teams make that decision. It separates the quarterbacks who got a chance from the ones who didn't at 0.92, against 0.78 for the college profile.
On the second question it's weak. Among quarterbacks who got the job, draft slot barely predicts who played well (a correlation of 0.17). The college profile does a little better (0.29), though with 75 quarterbacks we can't say it's better for sure. High picks also keep the job longer through bad play, which is how they rack up the good seasons that count as hits.
Most of the draft's edge, then, is that it hands out the snaps. That isn't the same as knowing who will be good.
What teams know that the public doesn't
Teams do know something, though. We found it by comparing them with a public scouting board.
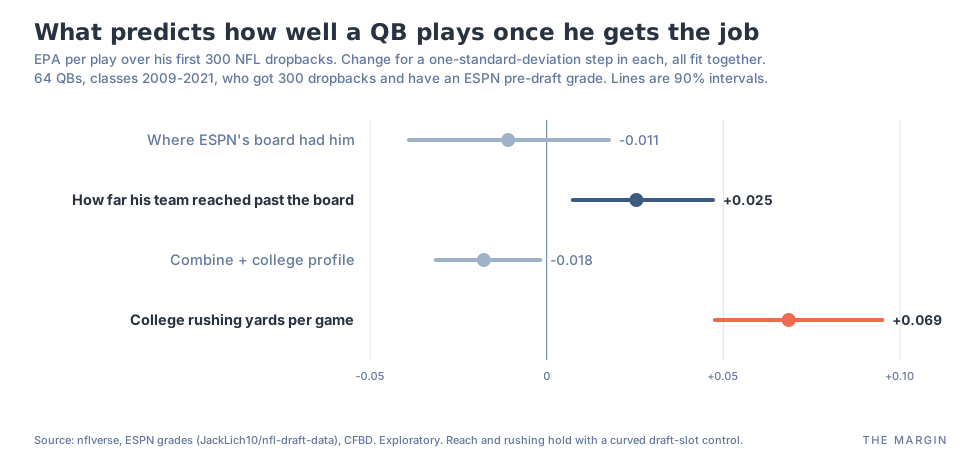
ESPN's Scouts Inc. publishes a grade for every draft prospect, and those grades line up well with where players go. We split each quarterback's draft slot into two parts: where ESPN's board had him, and how far his team reached past that, taking him earlier or later than the board implied. Then we looked at the 64 quarterbacks who got a real chance and had both a grade and full college stats, and asked what predicted how well they played.
 Tap to open full size, or swipe to pan.
Where the public board ranked a quarterback told us nothing about how well he played once he got the job. How far his team reached past the board did. Quarterbacks their team liked more than the consensus played better, by about 0.025 EPA per play for each standard step of reaching.
That's the part of the draft that's real information: workouts, interviews, film study, medicals, whatever a team sees in private. It isn't big, and it rests on 64 quarterbacks. It held in both halves of the sample (2009-2013 and 2014-2021) in the scouting test, and it holds when we control for draft slot as a curve instead of a straight line.
The one stat everybody missed: running
The biggest effect on that chart isn't a scout's opinion. It's college rushing.
Rushing yards per game in college barely moved a quarterback's draft position (a correlation of 0.02 with draft slot). It did predict how he played. Among quarterbacks drafted in the same range, the better college runners had better NFL careers, and part of that shows up in their passing numbers too, not just their rushing.
It also looks like teams caught on. The effect is strongest in the 2009-2013 classes and weaker since, with the Lamar Jackson and Kyler Murray era in between. The groups are too small to call that difference certain.
The profile's favorites who missed
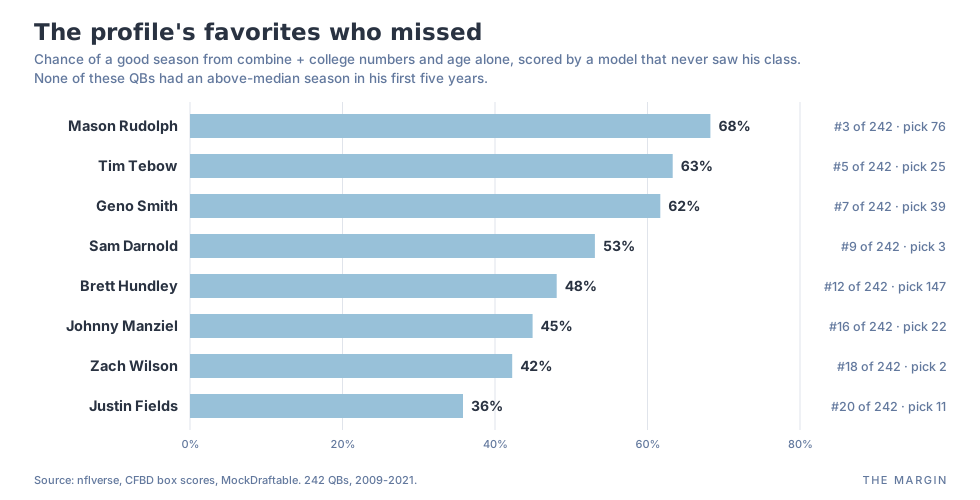
Before rushing, here's what a straight college-plus-combine profile liked, and what happened.
 Tap to open full size, or swipe to pan.
Most of these quarterbacks put up huge college passing efficiency. Mason Rudolph's final season at Oklahoma State was 10.7 adjusted yards per attempt, against a median of 7.9 in this group. Tim Tebow's career number was 10.4.
Teams were already skeptical of those numbers. Rudolph's profile said pick 13; he went 76th. Brett Hundley's said 19; he went 147th. Geno Smith's said 19; he went 39th. Better passing measures didn't help either. We tried opponent-adjusted efficiency, college EPA per play, sack rate and big-play rate, and none of them told us anything draft slot didn't.
The long shots who hit anyway
 Tap to open full size, or swipe to pan.
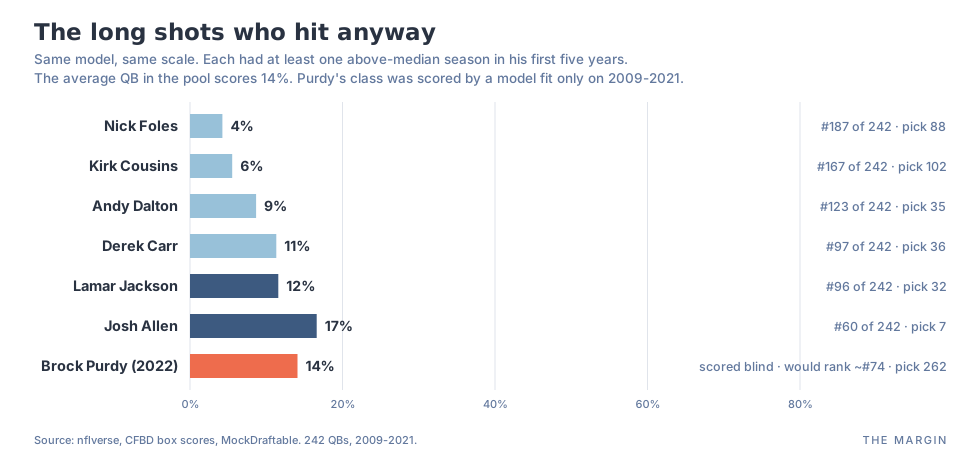
Josh Allen ranks 60th of 242 on paper. Lamar Jackson ranks 96th. Both completed about 57% of their college passes against a pool median of 62%, and the profile had no idea they could run. Lamar ran for over 4,000 yards at Louisville. Running is the one college stat that turned out to matter, and it's the one this profile left out.
Kirk Cousins (167th) and Nick Foles (187th) are harder to explain. Neither ran much, neither had standout college numbers, and both had good NFL seasons anyway. Then there's Brock Purdy, from the 2022 class, which we scored completely blind with a model fit only on 2009-2021. The numbers didn't see a long shot. They gave him a 14% chance, right at the average, which would rank him about 74th of the 242. The draft is what saw a long shot: his profile usually goes around pick 72, and he went 262nd, the last pick. In his case the stats were less wrong than the draft. We wrote about him separately.
What didn't matter
This list is as important as what did. None of these told us anything about NFL success once we knew where a quarterback was drafted:
- Team success: college wins, final AP ranking, SP+ ratings.
- Supporting cast: teammates who were drafted, team recruiting talent. If anything, quarterbacks from more talented rosters did slightly worse than their draft slot predicted, but it's a lean, not a finding.
- Pedigree: recruiting stars and rating, early declares, transfers, years in school, Heisman votes.
- Combine: the 40, the jumps, the agility drills, hand size, arm length.
- Better passing stats: opponent-adjusted efficiency, college EPA, sack rate.
Teams already account for most of these. The rest just don't predict much.
Other ways to keep score
EPA isn't the only way to judge a quarterback, so we checked wins, playoff wins and Pro Bowls too.
Draft slot beats the college profile on all of them, by the most on regular-season wins. That fits the rest of the story: you can't win games or make Pro Bowls without starting. The two signals from above hold up on the outcome that matters most. College rushing and a team's reach past the board both predict playoff wins in a quarterback's first five years. Neither clearly predicts Pro Bowls.
Five years isn't always enough
Our window is a quarterback's first five seasons. That's fair for judging a draft pick, but it isn't a whole career.
| QB | Pick | Profile rank | First good season |
|---|---|---|---|
| Ryan Tannehill | 8 | 206th of 242 | Year 8 (2019), then 2020 and 2021 |
| Jimmy Garoppolo | 62 | 119th | Year 6 (2019) |
| Sam Darnold | 3 | 9th | Year 8 (2025) |
| Case Keenum | Undrafted | 98th | Year 6 (2017) |
Tannehill was a top-10 pick with one of the weakest profiles in the pool, missed for seven years, then had three straight above-median seasons in Tennessee.
Where this leaves us
- The draft looks unbeatable mostly because it decides who plays. Draft slot predicts who gets the job far better than any college stat. It barely predicts who plays well once he has it.
- Teams do know something the public doesn't. When a team took a quarterback earlier than the public board did, he tended to play better. The board's own ranking predicted nothing.
- Running is the college stat that mattered. Teams barely priced it, it predicted NFL play, and it looks like they've started to catch on.
- Almost everything else was already priced in: passing efficiency, team success, pedigree, the combine.
How we did it: 242 prospects, classes 2009-2021, each scored by a model that never saw his draft class. The hit definition and the first round of tests were written down before any model was fit. Five follow-up investigations (opportunity, team context, advanced college stats, pedigree, scouting) each wrote their own test plan first. The reach and rushing results on playing efficiency come from a combined model built after those investigations, on 64 quarterbacks, so treat them as strong leads, not settled facts. We control for draft slot as a curve, not a straight line: a straight-line control let a feature built only from draft slot look predictive, which would have produced false positives. Data: nflverse; CFBD box scores (FBS only, 2004 on); MockDraftable; ESPN Scouts Inc. grades via the public nfl-draft-data repository. Scripts: nfl/qb_draft_signals_2026_09/.
Data in this article
More from The Margin
All analysis- Team EPA per play is free on The Margin now. Here's what it says about who wins Super Bowls.
Jesse McConnell, Oct 6, 2026. NFL, 5 min read
Offense and defense EPA per play for all 32 teams, free, on the team ratings page and every team file. Since 2015, 8 of 11 champions were above average on both sides of the ball, and none was below average on both.
- The Margin QB Grade: one number for every quarterback play
Jesse McConnell, Oct 5, 2026. NFL, 10 min read
The Margin QB Grade is the points a quarterback adds per play, 50 is average. Against eleven other ratings on 2016 to 2025, it tracked a game's scoring best (0.818, vs 0.712 for QBR and 0.688 for QBERT), tied with a four-stat blend. On stability and prediction, QBR, QBERT and others match or edge it. Hand-charted throw data didn't help.
- Team comps: what 12 lookalike teams can and can't tell you
Jesse McConnell, Sep 30, 2026. NFL, 6 min read
A new page: for any NFL team at any point in its season, the 12 most similar teams since 1999 and how they finished. We tested it before launch, and it predicts worse than a simple formula. What comps are good for (range, style, context) and what they aren't (forecasts, bets, playoff odds).