The 'nerd kings' are a myth. The QB the stats undersell is Brock Purdy.
Jordan Love and Justin Herbert get tagged as quarterbacks who look great to the analytics crowd and shrink when it matters. We ranked all 32 quarterbacks with 1,000+ dropbacks since 2022 on every stat in the argument. The label is wrong about Love, wrong about Herbert for a different reason, and the quarterback who really gets undersold is in San Francisco.
Thursday night was bad for Jordan Love. Atlanta won 35–14 in Green Bay, Michael Penix went 18 of 25 for 256 yards, and Love needed 53 attempts to get to 312 yards. That's 5.9 yards an attempt. You could hear the "nerd king" takes loading before the fourth quarter was over.
If you haven't run into the term: it's for quarterbacks the stats guys supposedly love who don't lift their teams when it counts. Love and Justin Herbert are the usual names. The comparison is usually Mahomes, Allen, Lamar and, lately, Brock Purdy.
It's been a talking point for years, so we tested it. One rule going in: comparing two quarterbacks against four of the best in football would make anybody look bad. So every number here is a rank against the full field, all 32 quarterbacks with at least 1,000 dropbacks from 2022 through Week 2 of this season, regular season and playoffs. Every chart shows all of them.
Short version: the label doesn't survive the data. But there's something real underneath it, and it isn't what people think.
Where they rank
Here's the whole argument on one table. Each number is a rank out of the full pool (lower is better).
| Rank of 32 unless noted | Purdy | Allen | Mahomes | Jackson | Love | Herbert |
|---|---|---|---|---|---|---|
| EPA per dropback | 1 | 2 | 3 | 5 | 6 | 19 |
| Success rate | 1 | 5 | 3 | 8 | 14 | 19 |
| Completion % over expected | 6 | 7 | 9 | 8 | 16 | 20 |
| Sack rate (lowest first) | 8 | 5 | 4 | 19 | 2 | 22 |
| EPA in crunch time | 9 | 6 | 8 | 14 | 11 | 22 |
| Comeback drives (of 27) | 20 | 2 | 6 | 5 | 4 | 17 |
| Playoff EPA (of 17) | 10 | 12 | 4 | 6 | 2 | 17 |
| EPA out of the pocket (of 30) | 9 | 2 | 1 | 4 | 12 | 20 |
| Designed-run EPA per game | 6 | 1 | 14 | 4 | 18 | 13 |
| Defense behind him | 6 | 11 | 10 | 4 | 13 | 8 |
The rest of this post is walking through that table.
Do the stats actually love these two?
The whole idea assumes the analytics crowd rates both of them highly. So check that first.
 Tap to open full size, or swipe to pan.
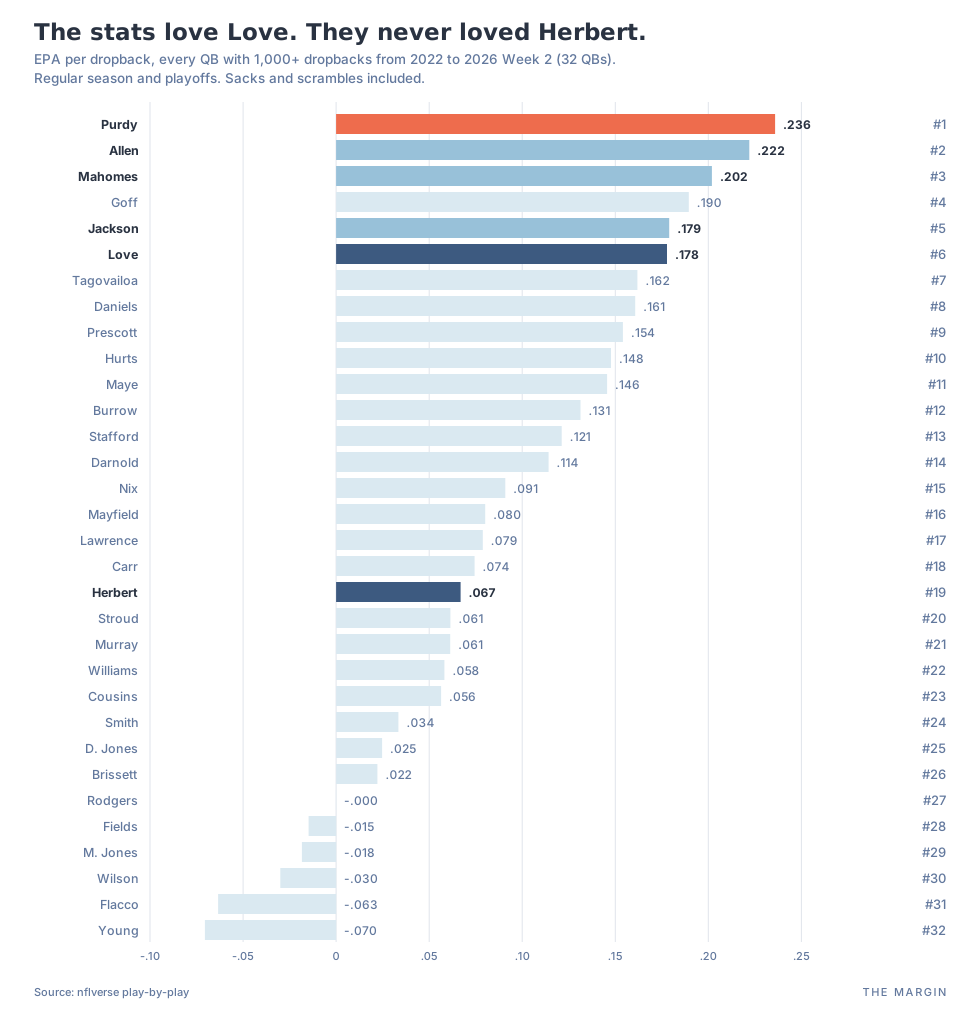
Love, yes. He's 6th of 32 in EPA per dropback, at .178. Lamar is 5th at .179.
Herbert, no. He's 19th, at .067, which is below the median quarterback in this pool (.079). He's 20th in completion percentage over expected. That isn't a stats darling. That's a middle-of-the-pack efficiency profile attached to a big arm and big yardage totals. If people overrate Herbert, it's the arm-talent crowd, not the spreadsheet crowd.
So we already have two different cases, not one.
"He wilts under pressure"
There are two kinds of pressure in this argument.
The pass rush. When the rush gets home (a sack, a QB hit or a scramble), Love ranks 13th and Herbert 12th. Both are a little better than the median quarterback, nothing special either way. The bigger difference is how often it happens: Love has the 2nd-lowest sack rate in the pool, Herbert the 22nd.
(Caveat: we built "rush got home" from sacks, hits and scrambles, not charted pressures. It's a proxy.)
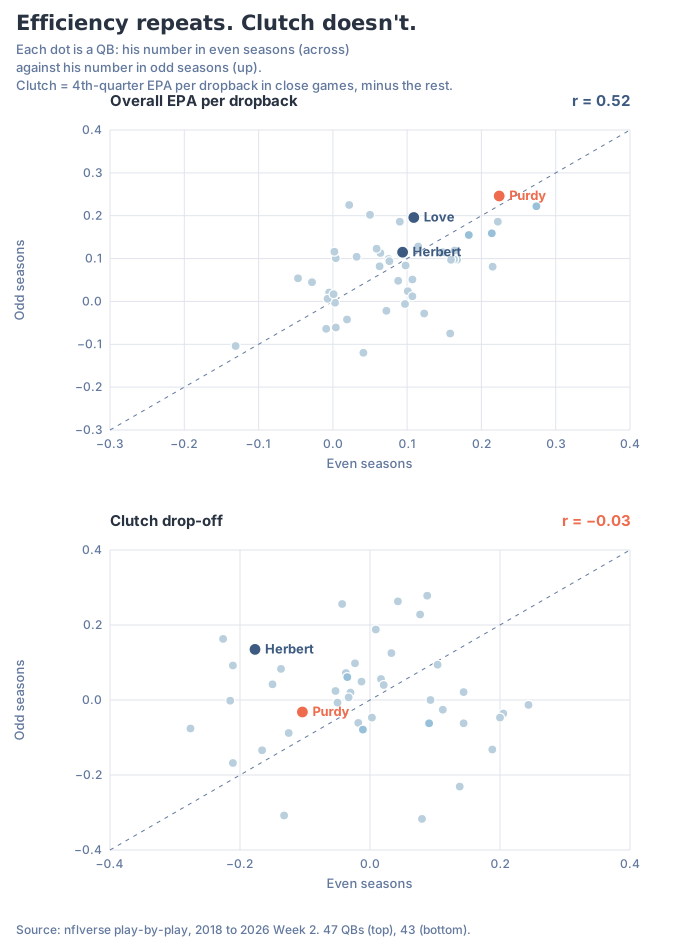
The game situation. This is what people mostly mean: the fourth quarter or overtime, one-score game. The first thing to know is whether being good in those moments is even a trait. We split every quarterback's career into even and odd seasons and checked whether his clutch drop-off in one half predicts the other.
 Tap to open full size, or swipe to pan.
Overall efficiency repeats (r = 0.52). The clutch drop-off doesn't (r = −0.03 across 43 quarterbacks since 2018, and −0.09 in the 2022-and-later pool). A quarterback who looks clutch in the even years is no more likely to look clutch in the odd years. We said the same thing when we built our QB rating, and more data hasn't changed it.
What does predict how a quarterback plays in crunch time is how he plays the rest of the time (r = 0.72). So the ranking you get in crunch time looks a lot like the regular one: Allen 6th, Mahomes 8th, Purdy 9th, Love 11th, Jackson 14th, Herbert 22nd.
On the drives the clutch argument is really about, trailing by one to eight in the fourth quarter, the league turns 36.4% into a tie or a lead. Love is at 41.2%, 4th of 27. Herbert is at 31.9%, 17th.
So what does separate the top guys?
What happens when the play breaks.
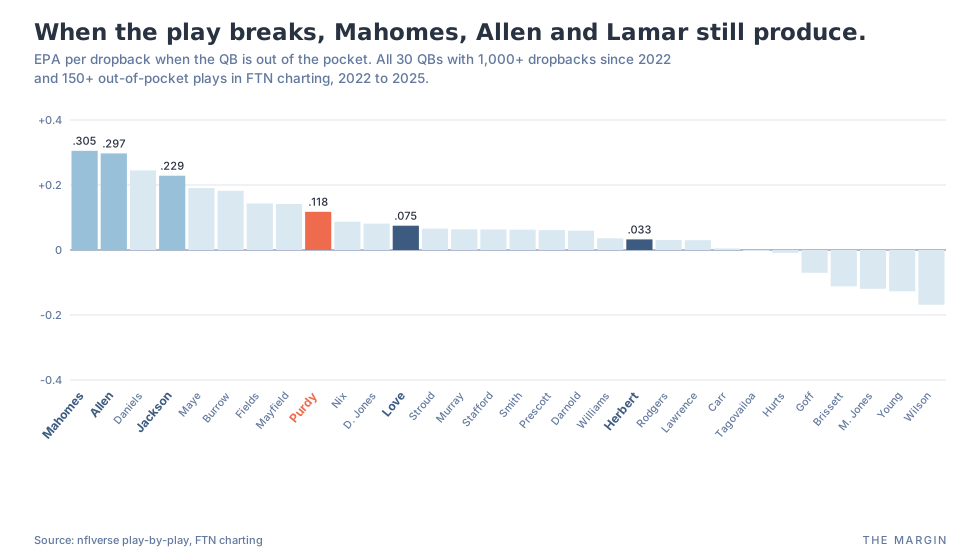
Everybody has plays that die: the first read is covered, the protection busts, the pocket gets muddy. What a quarterback does from there is a real skill, and it's where this group splits.
 Tap to open full size, or swipe to pan.
Mahomes is 1st out of the pocket, Allen 2nd, Jackson 4th. Allen and Jackson also rank 1st and 4th in value from designed runs, so they add a whole run game on top of it. Love is 12th out of the pocket and 18th on designed runs. Herbert is 20th and 13th.
Love and Herbert are pocket passers. When the play works as drawn, Love is very good. When it doesn't, there isn't much of a second life. That's the kernel of truth in the "doesn't lift his team" complaint: a lower ceiling on broken plays. It isn't nerves.
Herbert: the underperformance is real
We don't want to hand anybody a clean acquittal, and for Herbert we can't. Across the full field:
- 19th in EPA per dropback, below the median.
- 17th of 17 in playoff EPA (−.19 per dropback, on 127 dropbacks).
- 17th of 27 on comeback drives.
- And it isn't the defense: his has ranked 8th of 32 since 2022, better than Love's (13th) or Allen's (11th).
So if you want to say Herbert underperforms, the numbers are with you. Just don't blame the nerds. The efficiency stats have had him in the middle of the pack the whole time.
Love: the label doesn't fit
Love's line against the same field: 6th in EPA, 2nd in sack rate, 11th in crunch time, 4th on comeback drives, and 2nd of 17 in the playoffs (+.26 per dropback). His weak spots are off-script production and the run game, not big moments.
Thursday was bad. The career isn't.
The quarterback the stats undersell
Which brings us to Purdy.
Against the same 32 quarterbacks since 2022, Purdy ranks:
- 1st in EPA per dropback (.236; Allen is .222, Mahomes .202)
- 1st in success rate
- 1st in third-down conversion rate
- 6th in completion percentage over expected
By season he's been 1st (2023), 8th (2024) and 4th (2025). Our career QB rating has him first of 55 quarterbacks since 2016, ahead of Brees, Mahomes and Allen.
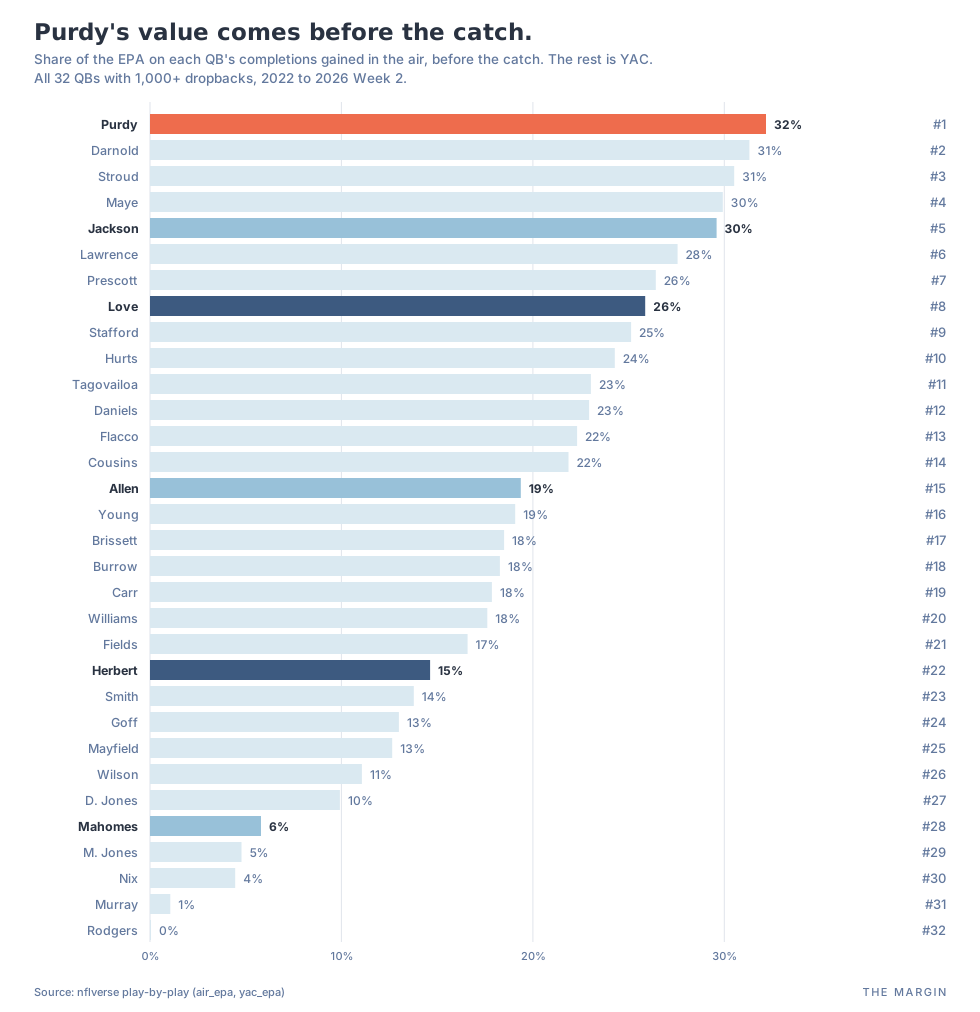
The standard rebuttal is "system quarterback, it's all yards after the catch." We checked that directly, and it runs the other way.
 Tap to open full size, or swipe to pan.
On his completions, 32% of Purdy's value comes through the air, before anybody catches the ball. That's 1st of 32. The median is 19%. Mahomes is at 6%, 28th: his completions are overwhelmingly yards after the catch.
The scheme helps him. Of course it does. So does a defense that ranks 6th and a skill group most teams would trade for. But he's the one putting the ball where it needs to be, on time, better than any quarterback in the league since 2022.
There are two fair pushbacks. One is sample: Purdy has 1,833 dropbacks in this window, Mahomes 3,111 and Allen 2,822. The other is late comebacks, where he's 20th of 27 on 23 drives. "He hasn't done it as long" is a reasonable thing to say. "He's a product of the system" is not what the numbers show.
Where this leaves us
- Love isn't a nerd king. He's an efficient pocket passer who has been very good in the playoffs and on late comeback drives.
- Herbert does underperform, but the efficiency stats were never the ones overrating him.
- Clutch doesn't repeat. How a quarterback plays in the fourth quarter is mostly how he plays all game.
- What separates the top tier is off-script production and legs.
- Purdy is the most efficient quarterback in football since 2022, and it mostly isn't YAC.
Keep checking our work
Everything in this post comes from the same data that runs the rest of the site, and you can follow it week to week:
- QB rankings. Every starter measured two ways: the Margin QB Rating for season-long skill, and QB Elo for current form adjusted for the defenses he's faced. Purdy is first on the career board. Love is 7th. Herbert is 26th.
- This week's game projections. A win probability and projected margin for every game, next to the Vegas line. As of Thursday night, the model gives Buffalo a 71% chance against Herbert's Chargers and the 49ers a 75% chance against Arizona. They're built to be calibrated, meaning a 60% call should come true about 60% of the time. They aren't picks, and they don't claim to beat the betting line.
- Live QB EPA. Every dropback graded as it happens on Sunday, one card per quarterback. It's the fastest way to check whether a "he wilts" take matches what's actually happening.
Data: nflverse play-by-play, FTN charting (out-of-pocket plays, 2022 to 2025), nflverse schedules and closing spreads. Pool: the 32 QBs with 1,000+ dropbacks from 2022 through Week 2 of 2026; the clutch-repeat test also uses 2018 to 2021. Scripts: nfl/nerd_kings_2026_09/.
Data in this article
More from The Margin
All analysis- Team EPA per play is free on The Margin now. Here's what it says about who wins Super Bowls.
Jesse McConnell, Oct 6, 2026. NFL, 5 min read
Offense and defense EPA per play for all 32 teams, free, on the team ratings page and every team file. Since 2015, 8 of 11 champions were above average on both sides of the ball, and none was below average on both.
- The Margin QB Grade: one number for every quarterback play
Jesse McConnell, Oct 5, 2026. NFL, 10 min read
The Margin QB Grade is the points a quarterback adds per play, 50 is average. Against eleven other ratings on 2016 to 2025, it tracked a game's scoring best (0.818, vs 0.712 for QBR and 0.688 for QBERT), tied with a four-stat blend. On stability and prediction, QBR, QBERT and others match or edge it. Hand-charted throw data didn't help.
- Team comps: what 12 lookalike teams can and can't tell you
Jesse McConnell, Sep 30, 2026. NFL, 6 min read
A new page: for any NFL team at any point in its season, the 12 most similar teams since 1999 and how they finished. We tested it before launch, and it predicts worse than a simple formula. What comps are good for (range, style, context) and what they aren't (forecasts, bets, playoff odds).