Which NFL teams are actually snakebit?
Some franchises really do lose more players to injury year after year. The effect is real, it is small, and a good part of it is the same injury being counted twice.
Every fan base thinks its team is cursed. Some of them have a case.
We took five seasons of NFL injury data, 2021 through 2025, and measured how much each team lost to injury six different ways. The first is FTN's Adjusted Games Lost, the long-running standard. The other five we built ourselves from public injury reports, reserve lists, snap counts and contracts. Then we asked one question: is injury burden a trait a franchise carries, or is it mostly luck?
 Tap to open full size, or swipe to pan.
Mostly luck, with a real team component
Team identity explains 17 percent of the variation in FTN's Adjusted Games Lost. The other 83 percent moves from season to season. That split is not zero. If injuries were pure chance, a figure this high would turn up about one time in 200. But it is not much to build a forecast on.
Our own measures land in the same place, between 13 and 28 percent. The more a measure leans on playing time, the higher it runs. The correlation between a team's injury burden one year and the next is 0.16 on FTN's numbers.
In practice: if your team was the most injured in the league last season, expect it to be somewhat more injured than average this season, not most injured again. Most of a single bad year should be discounted.
Who is snakebit
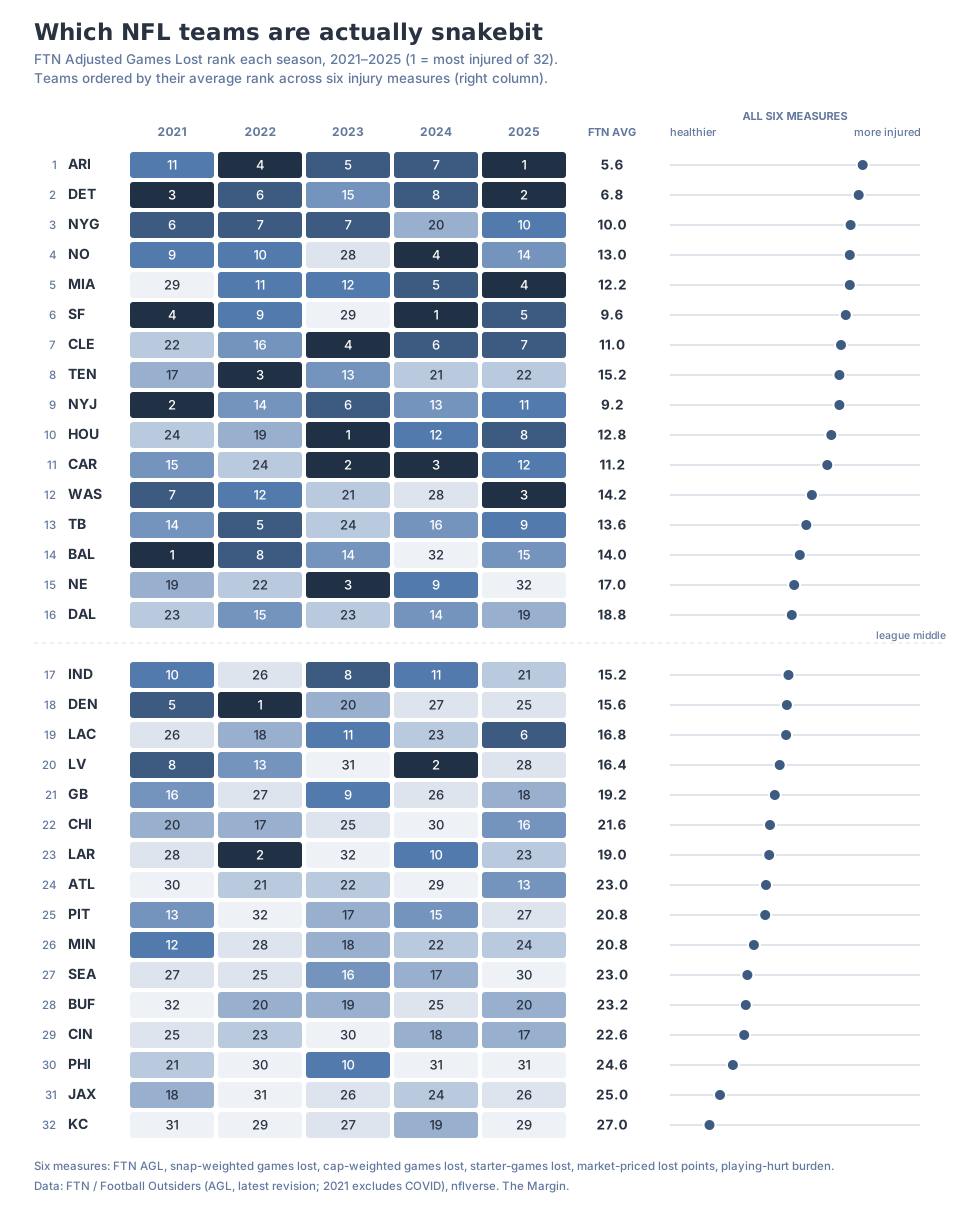
Arizona ranks first on FTN's numbers and on our market-priced measure. The 2025 Cardinals lost 179.8 adjusted games, the second-highest total FTN has recorded since 2001. Detroit ranks first on the snap-weighted count, where its defense does the damage. Averaged across all six measures, the Giants, Saints, Dolphins, 49ers, Browns, Titans and Jets fill out the rest of the ten most injured.
Three teams went all five seasons without a single year in the healthier half of the league: Arizona, Detroit and the Jets. Chance alone would produce about one team like that.
None of them is a proven outlier. Arizona's five-year run would happen by chance about one time in 200 for any one team picked in advance. We didn't pick Arizona in advance, though; we went looking across 32 teams. Account for that and the odds rise to roughly one in 12. That's suggestive, not settled.
The healthy end is steadier. Kansas City, Jacksonville, Philadelphia, Cincinnati, Buffalo and Seattle sit in the healthiest group on nearly every measure we tried. Kansas City ranked in the healthier half in all five seasons on FTN's numbers.
Some of it is the same injury counted twice
About 30 percent of the injury absences in our data belong to a player whose last snap came the season before. That's the December torn ACL still on the list in September.
Those absences are real, and the team really doesn't have the player. But they make "snakebit" look more like a franchise trait than it is: one injury shows up in two seasons. Take them out and the year-to-year persistence of our market-priced measure falls by more than half, to the edge of what could be chance. The snap-weighted measure holds up better.
Does the betting market know?
Yes.
Injuries cost teams on the field. A team's injury burden and its point differential move together (correlation −0.37 on FTN's numbers), and heavily injured teams win fewer games than their weekly point spreads implied.
But look at it game by game: take the same team in the same season, and compare its more-injured weeks with its less-injured ones. The closing line prices those absences about right. What's left over is small and not statistically distinguishable from zero. A simple rule of betting against the more-injured team whenever the gap was worth a point or more went 53.4 percent over 822 games from 2021 to 2025. You need 52.4 to break even at standard prices, and the result swung from 49 percent in 2022 to 61 percent in 2024. That's not an edge.
The market also knows injury luck doesn't repeat. Last season's injury burden tells you nothing about how a team does against the spread the following year.
2026 so far
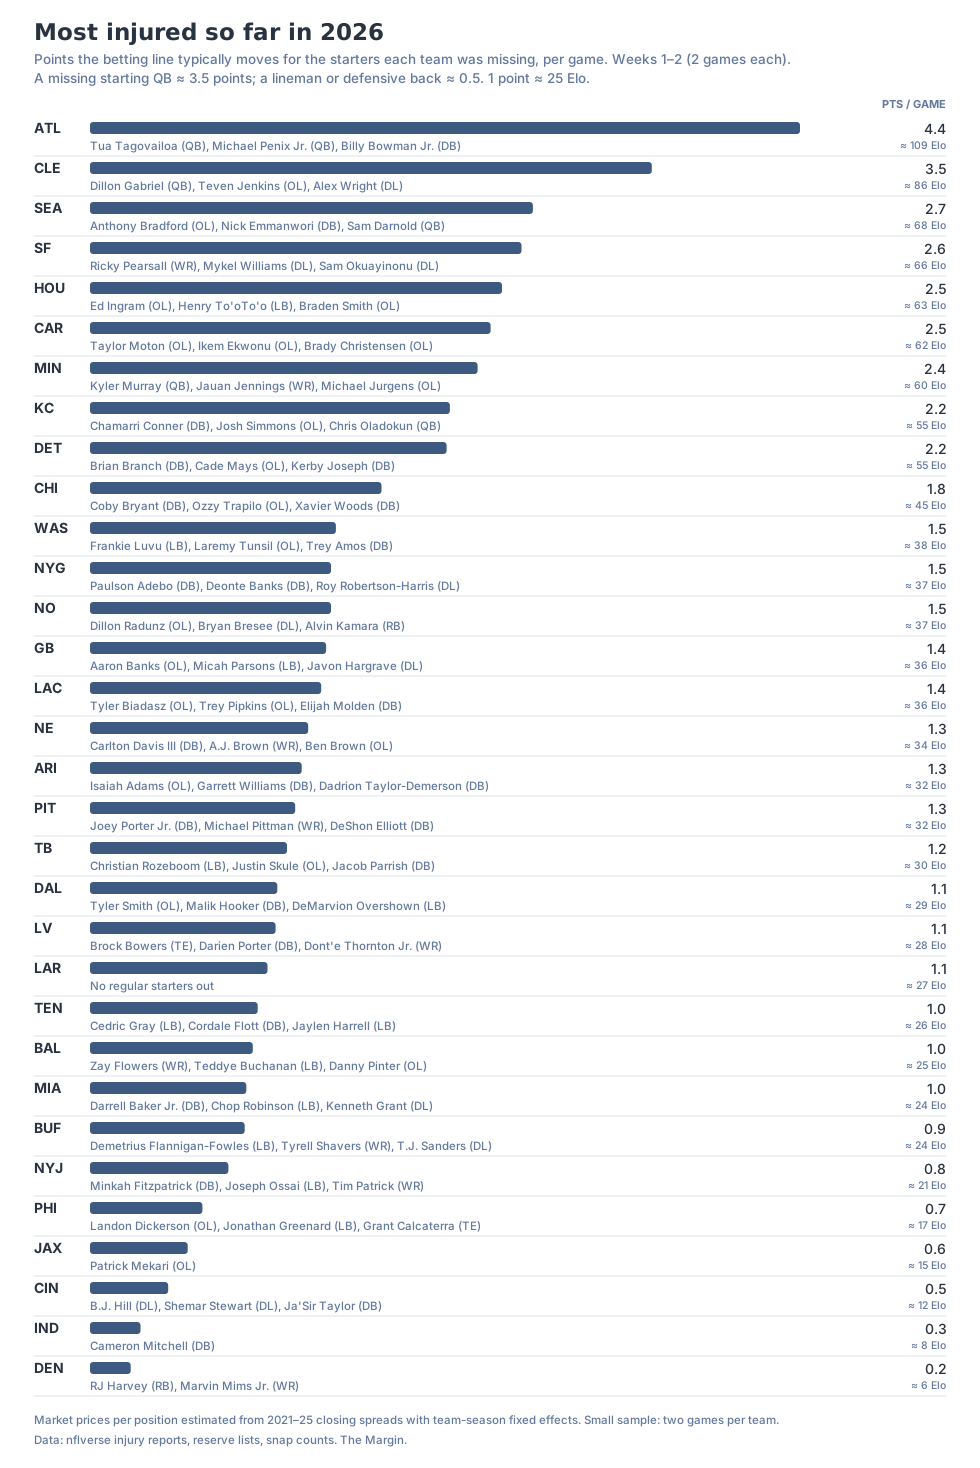
Two weeks in, here is who is missing the most, priced the way the betting market prices missing players.
 Tap to open full size, or swipe to pan.
Atlanta is the outlier. It played its first two games without both Tua Tagovailoa and Michael Penix Jr. We count only one missing quarterback per game, because only one can play, and the Falcons still lead the league. Cleveland, Seattle, San Francisco and Houston come next. Denver, Indianapolis and Cincinnati have been close to fully healthy.
Two games is a very small sample. Early-season injury lists also lean on players still out from last year. Teams' 2021–25 injury history does line up with their early 2026 snap-weighted losses (a rank correlation of 0.48), but much of that runs through those carryover injuries rather than fresh bad luck.
How we measured this
- FTN Adjusted Games Lost for 2021–2025 comes from FTN and Football Outsiders' published tables, using each season's latest revision. FTN revises past seasons. The 2021 figures exclude COVID absences.
- Snap-weighted games lost: each game a player missed with an injury, weighted by his recent share of snaps.
- Cap-weighted games lost: each game missed, weighted by the player's salary as a share of the cap.
- Starter-games lost: a plain count of games missed by established starters.
- Market-priced lost points: how far closing point spreads moved, on average, for each missing starter at each position. A starting quarterback is worth about 3.5 points; a lineman or defensive back about 0.5. A point is about 25 Elo.
- Playing-hurt burden: snap-weighted games lost, plus partial credit for starters who played while listed as questionable.
- Our snap-weighted measure tracks FTN's at a correlation of 0.83 to 0.91 each season.
- A separate analysis, run without access to any of these conclusions and built on its own measure, reached the same findings on persistence, on Arizona and on the betting market.
Data: FTN / Football Outsiders; nflverse injury reports, reserve lists, snap counts, contracts and schedules. 2026 covers weeks 1–2.
More from The Margin
All analysis- Team EPA per play is free on The Margin now. Here's what it says about who wins Super Bowls.
Jesse McConnell, Oct 6, 2026. NFL, 5 min read
Offense and defense EPA per play for all 32 teams, free, on the team ratings page and every team file. Since 2015, 8 of 11 champions were above average on both sides of the ball, and none was below average on both.
- The Margin QB Grade: one number for every quarterback play
Jesse McConnell, Oct 5, 2026. NFL, 10 min read
The Margin QB Grade is the points a quarterback adds per play, 50 is average. Against eleven other ratings on 2016 to 2025, it tracked a game's scoring best (0.818, vs 0.712 for QBR and 0.688 for QBERT), tied with a four-stat blend. On stability and prediction, QBR, QBERT and others match or edge it. Hand-charted throw data didn't help.
- Team comps: what 12 lookalike teams can and can't tell you
Jesse McConnell, Sep 30, 2026. NFL, 6 min read
A new page: for any NFL team at any point in its season, the 12 most similar teams since 1999 and how they finished. We tested it before launch, and it predicts worse than a simple formula. What comps are good for (range, style, context) and what they aren't (forecasts, bets, playoff odds).