Three weeks in, the plays can vouch for one supporting cast and against three
A 'Supporting Cast Rating' built from PFF grades has been ranking every team 1 to 32 on how much help its quarterback gets. We rebuilt it from every play of the first three weeks, then tested each piece to see whether it still moves with the quarterback. Two pieces did, so they came out. What's left can say one thing with confidence about four teams and not much about the other 28.
A list has been going around this week ranking all 32 teams on "Supporting Cast Rating" through three weeks. The question behind it is a good one. How much help is each quarterback getting from his line, his backs and his receivers? The build is the average of each team's PFF grade rank in rushing, receiving, run blocking and pass blocking.
The 49ers come out first and the Packers last, with a spot for everybody in between.
We think three weeks of data can't hold up a 1-to-32 list. We rebuilt it from the plays to find out what it can hold up. The answer was less than we expected, partly because our own first version had the same problem as the original: the quarterback was still in it.
What's wrong with ranking grades
There are three problems with how the list is built.
The quarterback leaks in. PFF's team rushing grade counts quarterback runs. Receiving grades depend on where the ball arrives. Pass-blocking grades depend on how long the quarterback holds it. "Everything except passing" still has a lot of passing in it.
Averaging ranks hides the gaps. When teams are bunched together, 8th and 20th can be a rounding error apart. The average also counts run blocking exactly as much as pass protection.
Three games is a small sample. Each team has about 110 dropbacks and 70 designed runs. The list doesn't say how much of its order is noise.
The rebuild
We started from all 5,814 run and pass plays of the first three weeks, joined to FTN's hand charting. FTN marks drops, catches made on bad throws, and whether a sack was the quarterback's fault. Every piece is measured in expected points added (EPA) against league average, so the pieces add up without anyone picking weights.
Our first version had three parts:
- Protection: sacks charged to the blockers, plus QB hits.
- Run game: designed runs by non-quarterbacks.
- Receiving: yards after the catch beyond what the NFL's expected-YAC model predicts, plus drops and catches on bad throws.
It dropped the obvious quarterback plays: his runs, scrambles, sneaks, and the sacks FTN puts on him. It also didn't let two kinds of luck swing a three-game sample. A dropped pass that ricochets into an interception counts as a drop, not a pick. A strip-sack the defense recovers counts as an ordinary sack.
Then the fair objection came in. The quarterback doesn't only affect his own plays. A quarterback who gets rid of the ball makes his line look good. An accurate one makes his receivers look good. A dangerous passing game should make the run game look good. So we tested it.
Testing for the quarterback
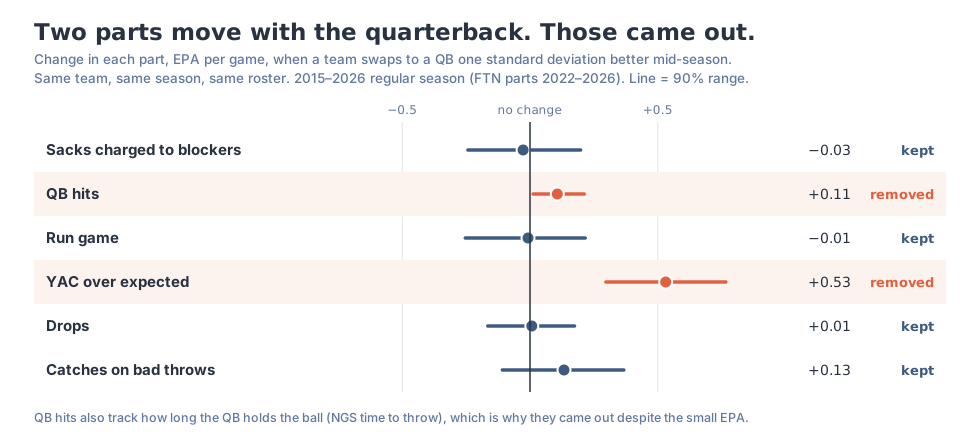
The cleanest test is a team that changes quarterbacks in the middle of a season. The linemen, backs and receivers are mostly the same, and only the passer is different. If a piece of the metric really belongs to the supporting cast, it shouldn't move when the quarterback does.
We found every mid-season starter change from 2015 through this season. We rated each quarterback only on his other seasons, so the plays being tested never feed his rating. Then we measured how much each piece moves when a team switches to a better quarterback. Two analysts ran the test separately, with different designs, and neither saw the other's work. Where they disagreed, we re-ran both on the larger sample.
 Tap to open full size, or swipe to pan.
Two pieces fail.
Yards after the catch follow the quarterback. Switching to a quarterback one standard deviation better adds about half an expected point per game in YAC over expected, with the same receivers. That's across 150 team-seasons, and it held under every version of the test we ran. It makes sense once you see it. The expected-YAC model knows where a receiver caught the ball but not whether he caught it in stride, so ball placement shows up as "receiver" YAC.
QB hits follow the quarterback. The effect in points is small, but hit rate rises with how long the quarterback holds the ball (NGS time to throw). Who the quarterback is explains about as much variation in hits as all the differences between teams do.
Four pieces pass: sacks FTN charges to the blockers, the run game, drops, and catches on bad throws. The run-game result surprised us. Box counts, run volume and run efficiency don't move when the quarterback changes. The run game does line up with quarterback quality across teams, but that comes from the roster and the organization, not from the passer himself.
So yards after the catch and QB hits come out. What's left is narrower, but it's the supporting cast.
The tiers
 Tap to open full size, or swipe to pan.
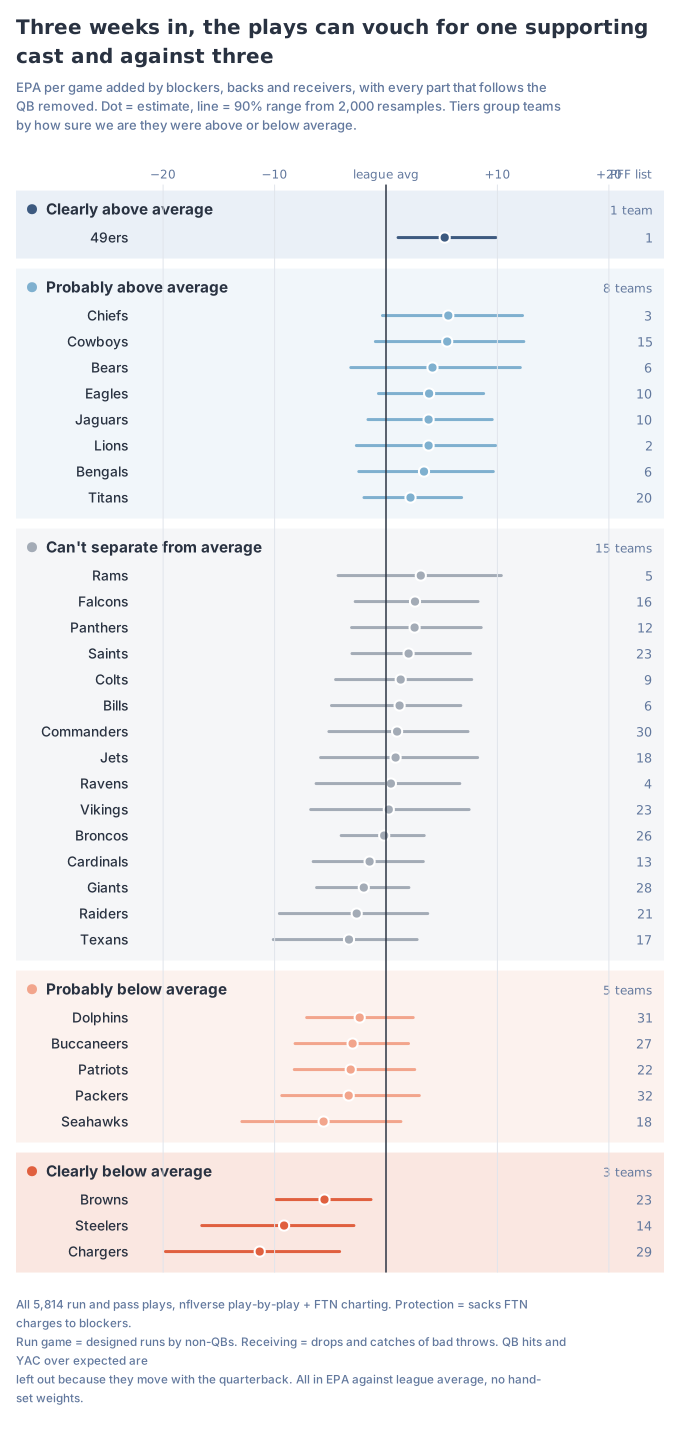
The dot is each team's value in EPA per game. The line is the range 90 percent of 2,000 resamples of that team's plays landed in. The tiers ask one question, set before we looked at who landed where: how sure are we that this team was above or below average?
Clearly above average: the 49ers, alone. "Clearly" here means we're confident they were above average, not that they were great. San Francisco's range runs from +1.1 to +9.9 EPA per game, so it clears the line, but barely. It rests on a handful of plays. The blockers haven't been charged with a sack in 89 dropbacks, Christian McCaffrey has been good on the ground, and Mike Evans has made three catches on bad throws. Those are worth 2.4, 1.7 and 3.3 points a game; Evans gave one point back on a drop. Take away those three catches and San Francisco's total falls to +2.1, one tier down. If the 49ers' cast looks ordinary to you on film, the numbers don't strongly disagree.
Clearly below average: the Browns, Steelers and Chargers. The Chargers are below average in every part and last overall. Pittsburgh's receivers dropped seven passes in three games, about double the league rate, and that's worth −7.3 EPA per game. Cleveland's run game is the problem, at −4.0 a game.
The 28 in between. Eight teams are probably above average: the Chiefs, Cowboys, Bears, Eagles, Jaguars, Lions, Bengals and Titans. Five are probably below: the Dolphins, Buccaneers, Patriots, Packers and Seahawks. Fifteen we can't separate from average at all.
Kansas City has the highest point estimate and still isn't in the top tier. Its run game is excellent at +5.3 a game. Its receiving was +5.3 as well, but more than four points of that was yards after the catch, the piece that follows the quarterback. Without it, Chiefs receiving is slightly below average. That doesn't make the receivers bad. It means we can't yet tell their yards after the catch apart from where the quarterback put the ball.
For a typical team, the range of ranks it could plausibly hold spans about 20 spots. The Chiefs rank 1st and could be anywhere from 1st to 18th. The Lions rank 7th, with a range of 1st to 23rd.
What held up and what didn't
This is the part that matters most for the original list. We built this three ways: the first build, then the two luck fixes, then the quarterback test. Here is what each version said about the teams that moved or held:
| Team | First build | After the luck fixes | QB pieces removed |
|---|---|---|---|
| 49ers | Clearly above | Clearly above | Clearly above |
| Chiefs | Clearly above | Clearly above | Probably above |
| Falcons | Probably above | Clearly above | Can't separate |
| Ravens | Can't separate | Probably above | Can't separate |
| Cowboys | Can't separate | Can't separate | Probably above |
| Eagles | Can't separate | Can't separate | Probably above |
| Packers | Can't separate | Can't separate | Probably below |
| Browns | Probably below | Probably below | Clearly below |
| Steelers | Clearly below | Clearly below | Clearly below |
| Chargers | Clearly below | Clearly below | Clearly below |
Nineteen teams changed tiers when we took the quarterback pieces out. Only three teams kept the same verdict at the extremes through every reasonable version: San Francisco on top, and Pittsburgh and the Chargers at the bottom. That's what three weeks can support. A 1-to-32 list reports the noise as if it were an order.
Who the cast is
Tap any team to see the names behind its number. Each bar shows a unit or a player against average in EPA per game. Green is above average, red is below, and gray is within half a point either way.
One thing to keep in mind when you look at the names: this measures what happened on the plays, not how good the players are. A line that allowed no sacks in three games gets full credit whether that came from talent, scheme, a soft schedule of pass rushers, or luck. The 49ers are the clearest case. The names on that line aren't the ones you'd expect at the top of a list like this. It has gone 89 dropbacks without a sack charged to it, and at the league rate that happens about 1 percent of the time. Purdy isn't getting the ball out unusually fast either: his time to throw ranks 11th longest. So the numbers don't say San Francisco has elite players. They say a few rare, good things have happened in three games.
A few ground rules. Linemen are graded as a unit. The five names are each team's top five offensive linemen by snaps. Nothing in the play-by-play or the charting says which lineman gave up a sack, so the grade belongs to the group. Backs are credited with EPA on their own designed runs, against the league average per carry. Receivers are credited with drops and catches on bad throws only; yards after the catch aren't credited, for the reason above. Everything is three games, so one drop or one tough catch can swing a receiver's number.
Where we disagree with the PFF list
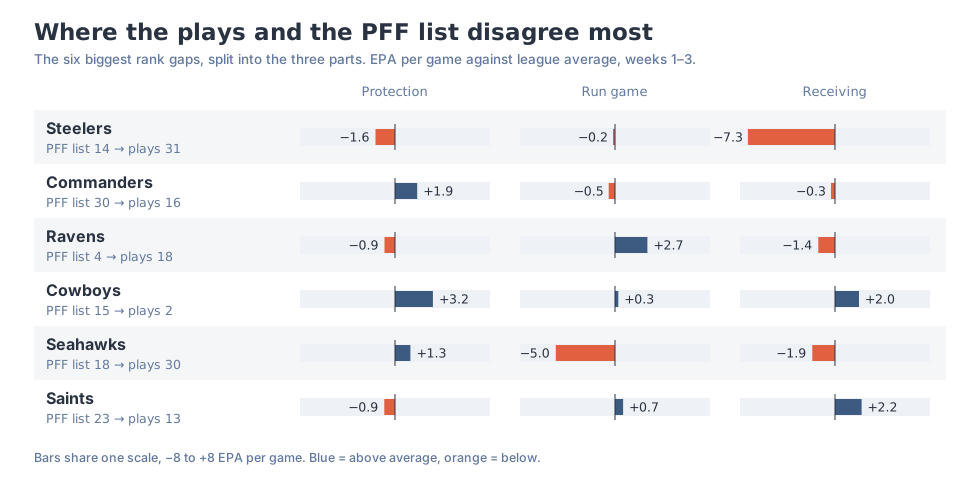
With the quarterback pieces removed, our order and the PFF list agree more than they did before. The rank correlation went from 0.57 to 0.67. PFF's graders are picking up something real. The biggest splits come from things a rank average handles badly.
 Tap to open full size, or swipe to pan.
- Steelers, 14th on the list, 31st here. It's the drops. A graded receiver can have one bad rep in 40 routes and still grade fine. In EPA a drop is a lost completion, and Pittsburgh had seven.
- Cowboys, 15th there, 2nd here. Dallas hasn't allowed a blocker-charged sack all season. All three sacks were charged to the quarterback.
- Ravens, 4th there, 18th here. The run game is good at +2.7, but protection and receiving give back most of it.
- Commanders, 30th there, 16th here. They're a bit above average in protection and close to average everywhere else. A rank average punishes a team with no standout category, and adding up points doesn't.
What this can't tell you
- Blocking versus backs. The run game credits each back with his own runs, but some of that belongs to his line. The stat that splits them, yards before contact, isn't published for week 3 yet.
- Individual linemen. Protection is graded for the line as a group. The data doesn't say who gave up a sack.
- Receivers, fully. With yards after the catch out, receiving is only drops and catches on bad throws. Those are real, but they're noisy over three games. Receivers who separate and create after the catch get no credit here, because we can't yet separate that credit from the quarterback's.
- Season-long quarterback effects. A mid-season switch catches what a quarterback does play to play. It can't catch an offense built around a star over years, like a scheme full of play-action and light boxes.
- Schedule. The tiers aren't adjusted for opponents. An adjusted version orders teams similarly (rank correlation 0.87). The biggest movers are Green Bay (28th to 16th), Arizona (21st to 12th) and Buffalo (15th to 7th).
- The future. This describes weeks 1 through 3. We didn't test whether it predicts anything.
The short version
San Francisco, Pittsburgh and the Chargers are the only teams that land in the same place however you build this. San Francisco's cast is above average, by a thin margin that rests on a few plays. Pittsburgh's and the Chargers' are clearly below average. For the other 29, three weeks of data can't order them with any confidence. A list that ranks all 32 is mostly ranking the noise, and some of what it credits to the supporting cast belongs to the quarterback.
More from The Margin
All analysis- Team EPA per play is free on The Margin now. Here's what it says about who wins Super Bowls.
Jesse McConnell, Oct 6, 2026. NFL, 5 min read
Offense and defense EPA per play for all 32 teams, free, on the team ratings page and every team file. Since 2015, 8 of 11 champions were above average on both sides of the ball, and none was below average on both.
- The Margin QB Grade: one number for every quarterback play
Jesse McConnell, Oct 5, 2026. NFL, 10 min read
The Margin QB Grade is the points a quarterback adds per play, 50 is average. Against eleven other ratings on 2016 to 2025, it tracked a game's scoring best (0.818, vs 0.712 for QBR and 0.688 for QBERT), tied with a four-stat blend. On stability and prediction, QBR, QBERT and others match or edge it. Hand-charted throw data didn't help.
- Team comps: what 12 lookalike teams can and can't tell you
Jesse McConnell, Sep 30, 2026. NFL, 6 min read
A new page: for any NFL team at any point in its season, the 12 most similar teams since 1999 and how they finished. We tested it before launch, and it predicts worse than a simple formula. What comps are good for (range, style, context) and what they aren't (forecasts, bets, playoff odds).